What is data science product management and why it's important
The main idea of this article is to introduce the specificities of a data science product management approach. TL;DR: Product management is the …

In a first article, I introduced what data science product management was about and why it is important. In this article, I would like to introduce a framework on how you can achieve building a valuable data science product, based on my personal experience and inspired by design processes.
Many companies are building data science products that aim to help users. Apple’s Siri, Netflix’s movie recommendations, and Amazon’s product recommendations are prime examples. They are designed to provide advice, recommendations, or automating repetitive human tasks, and so on. One important point to remember is that products powered by data science are not deterministic. They may behave differently in contexts that may look similar and they make mistakes; so how do we ensure that these mistakes don’t end up impacting us badly? Netflix recommendation engine is personalized. It won’t recommend the same shows or movies compared to other profiles with similar history if you only watch thrillers or comedies! Amazon will recommend new books based on your purchase history. If they recommend a bad movie or a bad product, it’s not a big deal, we move on. But what happens if it is a product that identifies cancer cells inaccurately, the consequences can be very serious!
The recipe for building valuable products always includes the same main steps:
To give you a sense of how important this topic is, know that Gartner predicted, back in 2019, that in 2022 only 20% of analytics insights would deliver business outcomes.
As simple as these two steps may seem, a common mistake I often made was to think of solutions before I clearly identified the problem to solve. You must first identify the proper problem to solve and only then defining a solution is essential to develop a successful product i.e. a product that achieves market fit, brings business value and solves user pain points. However this process is not fully linear. It is an iterative and continuous flow between the discovery (identifying problems to solve), experimentation and testing of potential solutions.
Marty Cagan explains it very simply in Inspired:
Customers don’t know what is possible, and with technology products, none of us know what we really want until we actually see it.
My goal for the rest of this article is to walk you through a framework that formalizes a process you can follow to guide you from discovery (identifying problems), to delivery (shipping the product that solves the specific problem at stake). This framework is adapted to the specificities of business problems one wants to solve with data science and analytics. Also, you should not follow it by the letter but rather as a set of guidelines on what to focus on at every step of the process. I’ll use a real life example, a product I shipped at a previous job as an example to help you get a more concrete sense of how this framework can be used.
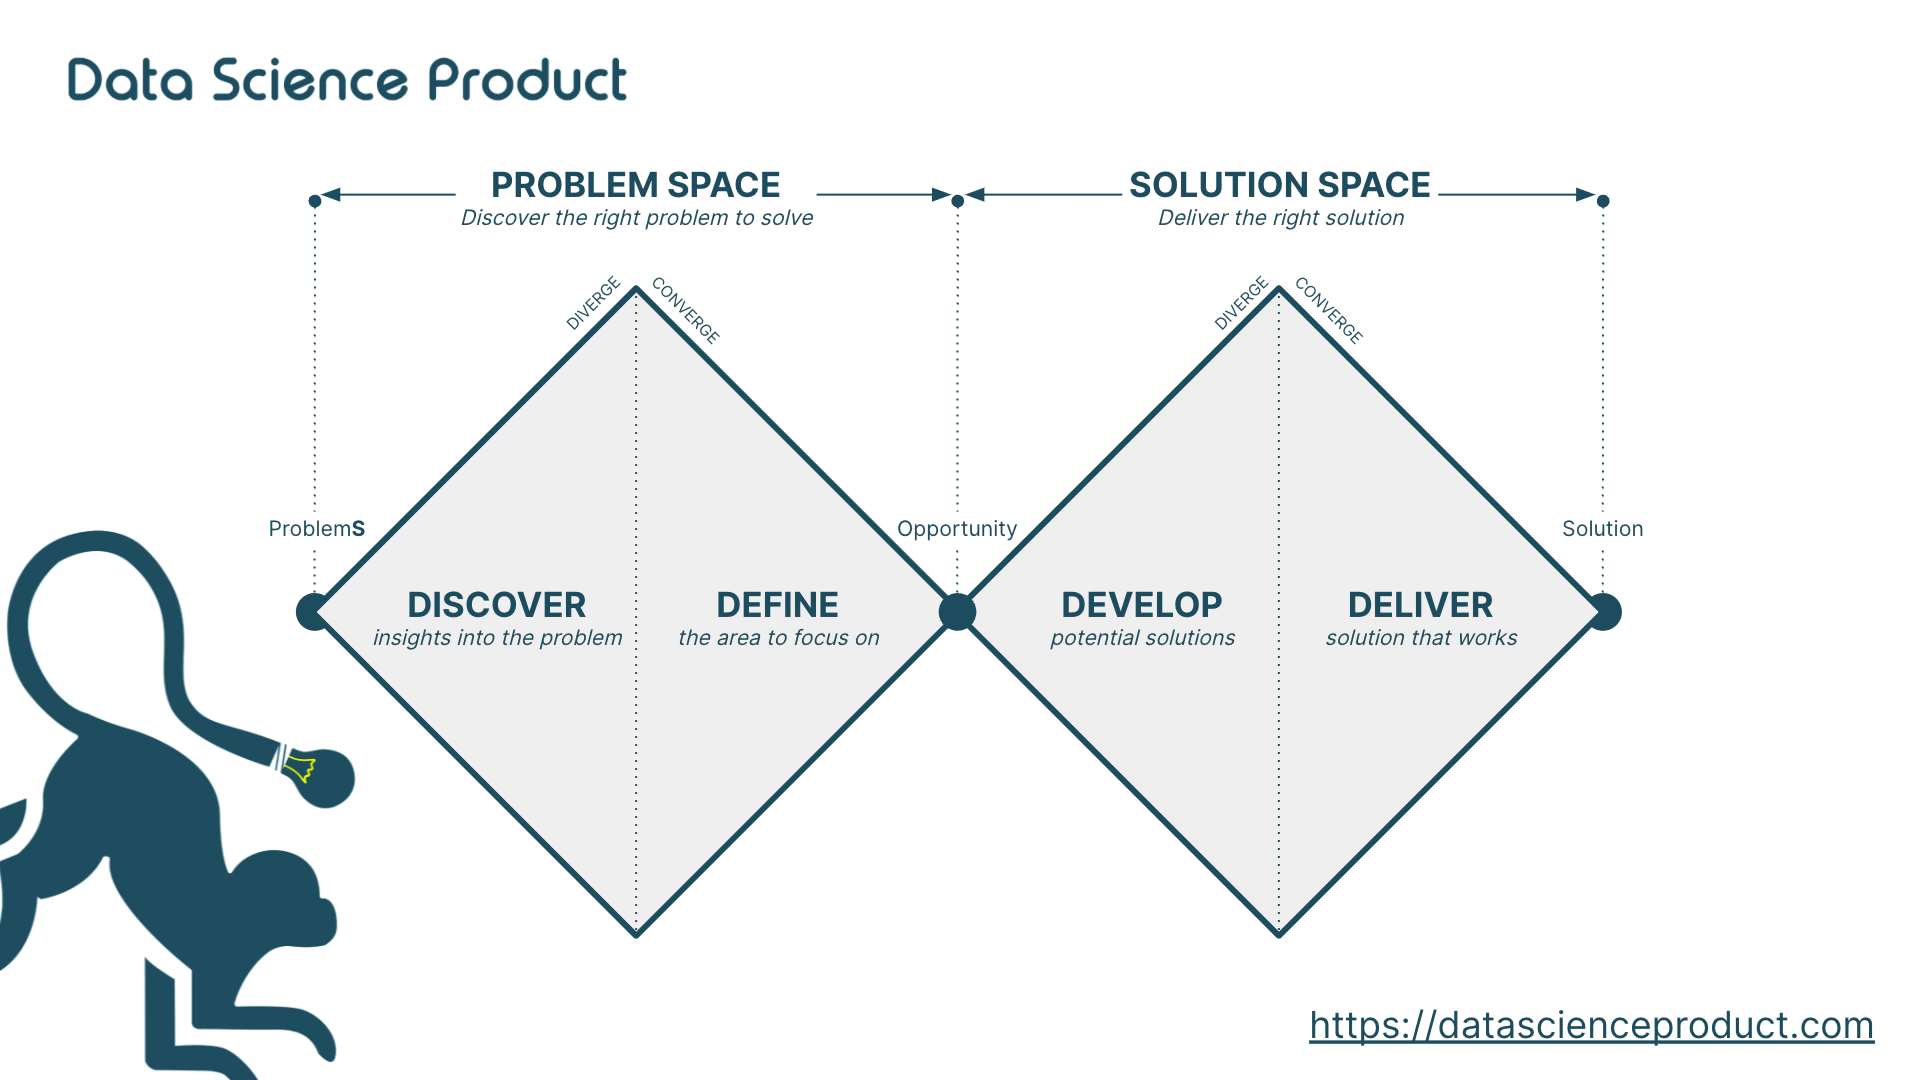
Before walking you through the main steps, let me share with you the origin of this framework. It is based on the “double diamond” design process model developed by the Design Council in 2005 (updated in 2019). Divided into four distinct stages – Discover, Define, Develop and Deliver – it symbolizes the divergent (exploring business opportunities) and convergent mindsets (focusing team effort to delivering them). It is well suited to product management at any maturity in product development.
The first diamond stands for the problem space, which aims to have a deep understanding of our market, our users, their issues and their challenges. When a problem is defined and measured, it becomes an opportunity.
The second diamond stands for the delivery space. It starts with a diverging phase with development and converging phase with delivering a solution that solves the single problem defined and refined during the previous stage.


This framework begins with a desired business outcome aligned with company strategy: increase revenue by 10%, increase retention rate by 5 points, reduce potential loss by 10%, etc. Starting with this outcome in mind, we can truly understand our user context and deliver a solution that creates value.
Let me illustrate how we achieved reducing significantly the number of fraudulent cases and potential loss, with a fraud detection product that my team and I built. We had a clear business outcome to achieve: reduce potential loss by x percent. We identified main losses through user interviews and data analysis. Based on these findings, we decided to solve this issue and build a dedicated product to help our users to identify fraudulent cases before losing money. How did we do it?
I will call this product Detective Chimp in the remaining part of my article :)
In the first step of this framework, we build up a portfolio of potential opportunities that might drive business outcomes. A crucial attitude to have here is to be as open as possible without limiting yourself. It is called a diverging phase. We need to keep our perspectives wide open to allow for a broad range. It helps us understand without being biased what opportunities and problems our users are really facing. It involves conducting research by analyzing the market, speaking to and spending time with users who are directly affected. Success metrics are detailed along with the findings to quantify the opportunities.
The purpose of this phase is to address critical risks when an opportunity is discovered:
For Detective Chimp, we looked at how valuable it was for our users to help them with fraud detection, how desirable it would be, what data we have and how difficult it is.
Let me share another example I like that illustrates scientific feasibility: During World War II, US bombers suffered badly from German air defense. One option was to add more armor. More armor means more weight, and adding too much would reduce maneuverability and increase fuel consumption. So, the US military reached the Statistical Research Group (SRG) at Columbia University with, by asking, “how much armor should we use for optimal results, and where should we put it?”
Only some data was provided such as the number of hits and their location on returning aircraft. The sample showed that damage wasn’t uniformly distributed, more bullet holes in the fuselage, not so many in the engines. US military was expecting to reinforce with additional armor the locations with the highest number of bullet holes – the fuselage.
Abraham Wald – a mathematician from SRG who was assigned to solve this problem – figured out the samples were missing aircraft that didn’t come back. He understood that the sample was not representative and recommended increasing armor in the areas that showed the least damage – the engine.
This story shows the importance of fully understanding the dataset acquired during discovery. The most important point that Abraham Wald verified is representativity of the sample provided by the US Army. If he didn’t verify it, it would have reinforced the fuse and wouldn’t have solved the initial problem.
In this second step, we methodologically prioritize the most promising opportunities among those in the portfolio that don’t provide any value for their effort. It is a converging phase which brings team alignment and focus on a single business opportunity to be developed. It ends with a clear definition and actual measurement of the problem to be solved.
To do so, we relied on prioritization techniques based on different criterias that define the value and costs of this opportunity.
One that works well for me with data science products is RICE, developed by Intercom. I won’t detail the method here (Intercom did it very well!) but in a nutshell for Detective Chimp, we answered the questions:
We estimated all these factors based on the findings from discovery phase:
Once estimated, we combined these factors into a single score through a formula:
We compared together all opportunities identified at a glance and a clear idea of what to develop next.
In addition, statistical techniques can significantly provide additional value in assessing opportunities identified. We can directly test our assumptions against quantitative evidence to define which one are most impactful. For example, we used descriptive statistics to quantify the problem that we were trying to solve with Detective Chimp: how often does fraud occur? How much do we lose? What is the mean amount we lose? How many cases can we prevent?
In the third step, we brainstorm with an open mind potential solutions for our business opportunities, develop prototypes to learn something at a lower cost, and measure their potential benefits. We undergo extensive iteration with users to ensure that they have fully addressed business opportunities uncovered during our discovery.
For Detective Chimp, we started to develop simple machine learning prototypes, built data pipelines, designed user experience and mock-ups. We tested it with users and measured the impact (in terms of model performance, usability and viability). We did it until we were satisfied with the result, then we delivered it to users :)!
I identified key specificities for developing the right data (science) product from brainstorming solutions, prototyping and testing:
In the end, the best prototypes we developed to solve our initial problem are delivered to users during the last stage. After model performance, the biggest challenges are how to access and process large amounts of data. They don’t only impact prototypes, but also have a large influence in the quality of the solution.
Delivering data science models is a challenging topic in itself. They are unique because of their highly specialized requirements for production lifecycle management. For instance, what happens when your data changes? What happens when our predictions change? What happens when human processes change? How do we know that our prediction was incorrect? Dedicated articles will focus deeply on this aspect.
Well, once released and impact measured, we arrived at the end of this double diamond journey. When Detective Chimp was launched, we closely monitored during the first months: how many users used it (Reach)? How many fraud cases did we detect and prevent? How much did it impact our desired outcomes (Impact)? In less than one year, we reduced potential loss greatly by reducing the number of fraudulent cases.
This is not a linear voyage, a new one will start all over again with new improvements. However, new findings in data can send us back to the beginning (but with more experience). Making and testing very early stage ideas can be part of discovery.
My last advice to finish this first part, iterate!
A second part will go into more details about product management and data science lifecycle.

The main idea of this article is to introduce the specificities of a data science product management approach. TL;DR: Product management is the …